Observability Significance
“Observability depends on stitching together the story of a transaction as it moves across subsystems.”
IBM OMEGAMON suite and software have been a staple of Z monitoring for decades, reducing outages by empowering operations teams and system experts to recognize and fix issues faster.
However, in recent years, OMEGAMON shifted from traditional monitoring to a critical observability enabler. With the release of OMEGAMON AI for CICS, IBM introduced capabilities that bring the mainframe directly into the observability ecosystem, allowing organizations to analyze, correlate, and act on performance data in ways that were never before possible. The IBM Z OMEGAMON AI for z/OS product takes advantage of the Tivoli Management Services on z/OS infrastructure.
“IBM Z OMEGAMON AI Insights…enhance operational visibility by identifying patterns and unusual behavior in OMEGAMON AI for CICS workloads using machine learning models.”
I had the opportunity to discuss these capabilities with Planet Mainframe’s CICS Virtual Mainframe User Group. For full details, you can ▶️ watch the video session, download my presentation, or read the transcript.
Reactive Monitoring vs Proactive Observability
Monitoring tells you what’s wrong, but often after the fact. Observability equips teams to understand why something is wrong by drawing insight from system outputs such as metrics, logs, and traces.
This is where OMEGAMON’s evolution stands out. While once confined to green-screen dashboards and siloed reports, OMEGAMON data is now streamed into open formats, integrated with other enterprise observability tools, and enriched with AI-driven analytics.
OMEGAMON’s Evolution: From Dashboards to AI Insights
The introduction of AI Insights in OMEGAMON 6.1 creates dynamic baselines for metrics like CPU consumption and transaction response times, instead of static thresholds that quickly become irrelevant in dynamic, high-volume systems.
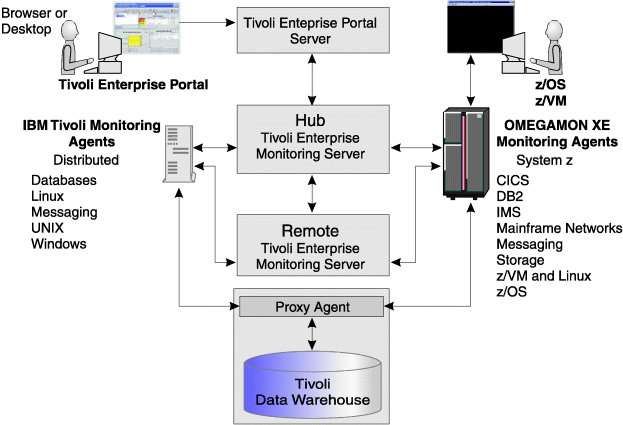
By applying machine learning to historical SMF data, the system recognizes normal behavior patterns based on time of day, workload type, and seasonal variation. When performance strays significantly from those baselines, anomalies are flagged immediately. This closes the gap between reactive monitoring and proactive observability. See Figure 1.

Figure 1: IBM Z OMEGAMON AI for z/OS Agent-server-client architecture.
Source: IBM
Scaling Task History for Context-Rich Observability
Another step toward full observability is the massive expansion of task history. For years, OMEGAMON limited its history collection to 4 GB per region, a constraint that frustrated operations teams during investigations. Now, with extended linear datasets, history scales up to 16 terabytes, supporting millions of additional transactions.
Equally important, with OMEGAMON 6.1, task history processing has been offloaded to zIIP processors, reducing the cost of deeper data retention and freeing up general-purpose CPU cycles. Observability thrives on context-rich data, and this change ensures more of it is available, longer, and at a lower operational cost.
“Observability thrives on context-rich data.”
From Guesswork to Evidence-Based Analysis
Observability depends on stitching together the story of a transaction as it moves across subsystems. A significant improvement is the correlation between CICS transactions and Db2 threads. Where analysts once had to hunt down correlation IDs manually, OMEGAMON now provides a seamless drill-down from a CICS task into the Db2 perspective. This ability to pivot across subsystems transforms troubleshooting from guesswork into evidence-based analysis is one of the central promises of observability.
Providing key information at the earliest vantage point is, by definition, observability:
- A new feature that displays transaction average response time by CICS region identifies issues in an application or CICS system before they become unresolvable.
- The ability to point and click this field, uncovering the transactions that are taking longer to complete at the minute level, gives someone the ability to observe and quickly act, ensuring maximal performance and throughput.
- Features like transaction rates displayed per second, customizable column ordering, bookmarking, and background task filtering may sound incremental, but they are vital in making observability actionable.
Observability is not just about data—it’s about accessibility. By simplifying navigation across hundreds of CICS regions and allowing users to tailor the interface, OMEGAMON ensures critical insights are not buried in complexity.
“Observability is not just about data—it’s about accessibility.”
Making Observability Actionable
The real power of observability lies in proactive detection. OMEGAMON AI has already demonstrated its value in production use. In one case, a customer faced a post-upgrade CPU spike that could have gone unnoticed for weeks. However, the issue was flagged immediately with AI-driven anomaly detection, saving roughly €60,000 in unnecessary MSU charges.
Similar use cases include detecting abnormal response times, unusual network behavior, or workload distribution anomalies—scenarios where static rules would miss the signal.
“AI-driven anomaly detection flagged the issue immediately, saving roughly €60,000 in unnecessary MSU charges. “
With every release and fix pack, OMEGAMON AI for CICS becomes less of a monitoring tool and more of an observability platform. Expanding visibility, correlating across subsystems, enabling dynamic thresholds, and embedding AI empowers mainframe teams to understand what is happening and why—and to act before service degradation or cost overruns occur.
Breaking Silos: Observability Strategies Across Enterprise IT
Observability is about breaking silos, and with OMEGAMON AI, IBM Z is no longer the exception in the enterprise stack. It is a first-class citizen in observability, delivering the transparency and intelligence needed to run hybrid systems with confidence.
As observability gains traction in the IBM Z world, it’s not just IBM leading the way. Rocket Software, where I work, has also invested heavily in observability and AI.
Innovations like AI-driven anomaly detection and predictive analytics are coming to a mainframe near you, and tools like Rocket C\Prof delivers transaction-level observability for CICS, helping teams trace performance issues down to the program call level.
Next Steps for Mainframe Teams
Today, enterprises can build a comprehensive observability strategy that spans:
- proactive anomaly detection
- deep subsystem correlation
- transaction-level transparency
This approach empowers both operations and development teams. It also ensures that the mainframe is fully integrated into the enterprise observability stack, not siloed from it.
Sign up for the next CICS User Group Session or browse previous CICS sessions and conversations.


0 Comments