Enterprise Performance Strategies, Inc. (EPS) has a long and deep history with all things mainframe performance and capacity planning. EPS experts have worked extensively in z/OS design, development, and measurement architecture, as well as having worked with hundreds of mainframe shops in every industry you can think of. We have helped many installations optimize their hardware and software resources, enhance the performance of their workloads, and both understand and reduce their MSU usage.
EPS offers a variety of mainframe performance services, including educational webinars, in-depth performance workshops, and Health Check® War Room consulting engagements. However, the premier EPS offering is Pivotor®, a unique and powerful tool and service for performance reporting and analysis of mainframe software and hardware environments.
Actual Intelligence is a Key Component of EPS’s Mission
EPS understands that Artificial Intelligence (AI) on the mainframe is popular these days, but for now, EPS cautions everyone about fully embracing the AI hype when it comes to mainframe performance management. Although AI is improving, it is risky to assume that it has gathered all the right information and generated appropriate recommendations for every situation. We use our own expertise in mainframe analysis and capacity planning to help customers achieve optimal mainframe performance. It is critical that you continue to embrace and train your IT staff with Actual Intelligence to maintain the skill set needed to make decisions based on good business judgment and technical skill. As this is a key part of our mission, we accomplish this by offering the following:
- Mainframe performance workshops
- Mainframe performance War Rooms and consulting
- Pivotor reporting software, for ongoing insights into mainframe performance and capacity planning
Performance Workshops and War Rooms: Gaining Actual Intelligence
EPS shares Actual Intelligence about z/OS performance and capacity planning by offering a series of performance workshops.
What makes EPS’s online performance workshops special and of high value compared to others? First, these workshops are taught by qualified instructors and mainframe performance experts, myself [Peter Enrico] and my colleague, Scott Chapman. Our depth and breadth of knowledge in mainframe performance is hard to find in the industry today. Our expertise and teaching skills are so well regarded that we are often consulted by large vendors and service providers so that they may draw from our experiences and insights.
In addition, EPS workshops are unique because before each workshop, we request a set of performance data to work with during class. During each workshop, the student will not only learn the subject matter being taught, but they will also do class exercises on their own data. These workshops are not just about gaining valuable skills, but also about completing a productive analysis and returning to work with recommendations and insights.
Workshops are available as both scheduled public classes, as well as private instruction in certain cases. Visit https://www.pivotor.com/index.html#workshops for our up-to-date schedule and more information.
If you are looking to solve complex performance problems, War Rooms are a great option for an intensive and collaborative 2-day engagement with our experts.
Pivotor: Performance Reporting with Actual Intelligence
The EPS Pivotor solution is our flagship product. It is a very competitively priced offering and is not like the rest of the z/OS SMF data reporters on the market. What makes Pivotor exceptional is that it was conceived, designed, and developed by mainframe performance experts who have experience in z/OS design and development, as well as having worked with hundreds of mainframe shops. Our expertise and experiences are infused into the product. One of Pivotor’s fundamental goals is to ensure the mainframe community benefits from the Actual Intelligence of the years of experience that is built into Pivotor.
While AI is trendy right now, Pivotor will help ensure that any mainframe shop will not only gain the insights they need for effective performance management but also be able to utilize the built-in education to keep the performance management skill level of its users high and sharp.
Pivotor has the features expected in a performance data reporter, but also some unique features not found in other offerings:
- Many unique and clever reports:
Sure, like all other reporters, Pivotor has the typical measurement reports, reported in typical ways. However, we also have a large set of truly unique reports not found in other products. These clever and insightful reports highlight the Actual Intelligence built in. - Outlier detection:
Pivotor’s Outlier detection and reporting harnesses machine learning to flag unusual data while avoiding many of the pitfalls exhibited by traditional anomaly detection techniques. Finding anomalous measurements is important, but the real value is that Pivotor makes those findings available to the z/OS performance analyst in a suitable and user-friendly format. - Playlist analysis:
Pivotor’s reports are well organized and accessible via a navigation panel. As an added feature, Pivotor highlights what we call reporting “playlists”. Similar in concept to a music playlist, a Pivotor playlist will “play” a canned analysis with explanation of a client’s reports. Think of these playlists as a thought-out sequence of reports that walk a user through an analysis. Along the way, the user is presented with “helps”, and when possible, recommendations based on Actual Intelligence. - Pre-generated reports:
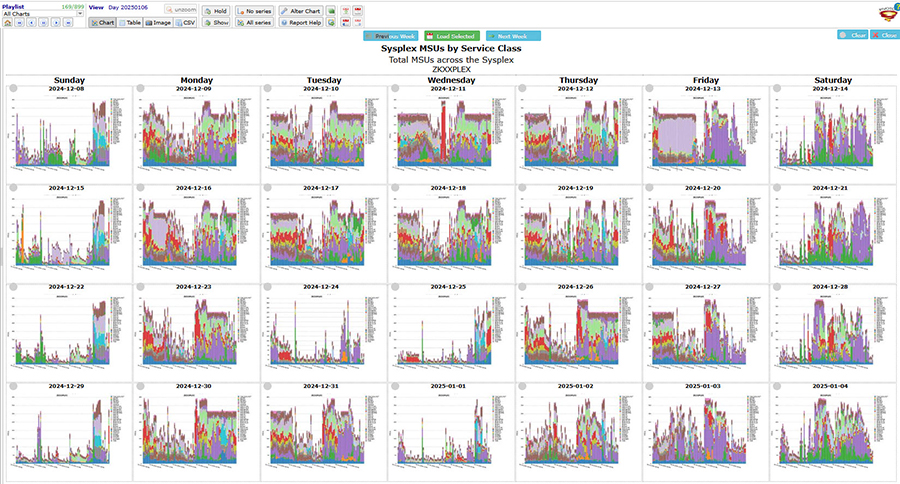
All Pivotor reports are pre-generated. This not only has the advantage of making the reporter super-fast, but it also allows for historical assembly and viewing of the reports for any chosen period. All reports are also viewable in a calendar format as one way for the analyst to note trends.
See Figure 1.
- Sophisticated exception reporting:
Pivotor’s exception reporting can employ both simple and complex conditions based on cross examination of values across different data sources and can base exceptions on rules, thresholds, deviations, and frequency. In addition, Pivotor has the smarts to separate and highlight reporting of “exceptions met and really warranting investigation” versus just “exceptions met”. - Automatic data aggregation and un-aggregation:
This is one of Pivotor’s most powerful features and needs to be seen to really be appreciated. To maintain long-term data, most other products sacrifice granularity by summarizing into hourly averages, daily averages, etc., and then throw away the granular data. Instead, Pivotor keeps the granularity of data and then automatically aggregates that data during the reporting experience. The user can then “zoom” to un-aggregate the data.

Pivotor has many additional noteworthy features, and to pique your interest further, here is a quick summary of some of these features:
- Support for nearly all major SMF records, DCOLLECT, z/VM, IMS perf logs, and more
- Reports available in both Dashboard and Calendar format
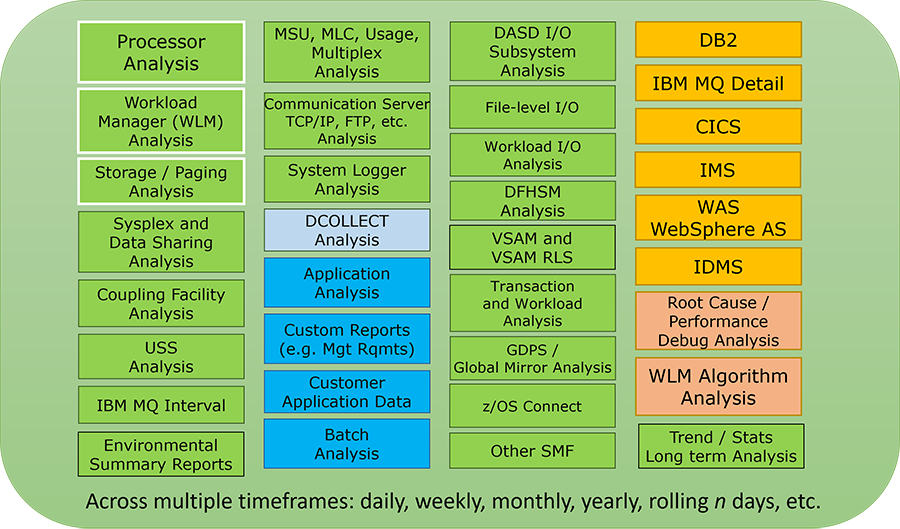
- Thousands of canned reports out of the box (See Figure 2)
- Data explorer report interface to create your own reports
- Long-term reporting for trending
- Expanded help to explain reports and usage
- Custom reporting
- Ability to incorporate business metrics into performance reports
- Ability to support customer application measurements
- Report overlays for visual comparison
- Sophisticated search and tagging of reports for drilldown
- Flexible time filtering and zooming
- Application attribution to allow the reporting of identified applications
- Report data downloadable in CSV format
- And much more!

In addition to all the Pivotor features, our clients benefit from annual cursory performance reviews and the EPS staff are available to answer performance questions throughout the year. Such questions can be as simple as “what does this report mean?” to “I just upgraded to a new level of z/OS, can you tell me how things are performing?”, to “We are thinking of upgrading to a new processor, can you tell us your thoughts?”. We also proactively inform customers of recommendations and possible performance problems.
Last, but Not Least: Free Educational Webinars
EPS regularly holds free educational webinars on a wide range of performance subjects. These webinars range from 30 minutes to an hour, followed by Q&A on any subject. These webinars are pure mainframe performance education and are great for everyone, from newbies to the seasoned professional.
We encourage the readers of this article to visit EPS’s website at https://www.pivotor.com/ to find our posted webinar schedule, as well as to gain access to past webinar presentation decks.
We also encourage you to visit https://www.pivotor.com/cursoryReview.html for a free cursory performance data review. Participants always leave these reviews with valuable recommendations. Not too bad for free.
Final Thoughts
Our premier, unique, and cost-effective performance measurement reporting solution (Pivotor), along with our education and consulting offerings, lays the path for clients to gain the Actual Intelligence performance skills necessary to make their jobs easier and management happy.
Our goal at EPS, and the goal of the Pivotor software, is to ensure that EPS clients have optimized usage of their mainframe hardware and software resources, can achieve optimal workload performance, and can easily understand, track, and reduce MSU consumption.
Please visit us at https://www.pivotor.com/ for more information and to sign up for a free cursory performance review with your data or a demo of the Pivotor reporting product.


0 Comments