


Recently, the Virtual CICS User Group hosted Ezriel Gross, a Principal Solutions Advisor at Rocket Software, specializing in IBM CICS tools. With a wealth of experience as a gold consultant and IBM champion, Gross co-architected the C\Prof product, a revolutionary tool that captures CICS trace without running within a CICS region.
During his useful presentation, Gross addressed the challenges faced by organizations when it comes to problem analysis and performance tuning for CICS. These challenges range from complex code to skill shortages. To help professionals tackle these issues, Gross developed a comprehensive methodology called Detect, Verify, and Solve which uses a suite of tools now available for analyzing CICS performance.
The first step, Detection, involves using suitable monitoring tools like IBM OMEGAMON for CICS to understand the frequency and severity of problems. Historical data plays a crucial role in this stage, enabling a thorough analysis and remediation process.
Verification comes next, employing tools like CICS Performance Analyzer or SMF data analysis to validate the observations made during the detection phase. This deep dive analysis allows for a comprehensive understanding of system performance, especially during peak periods.
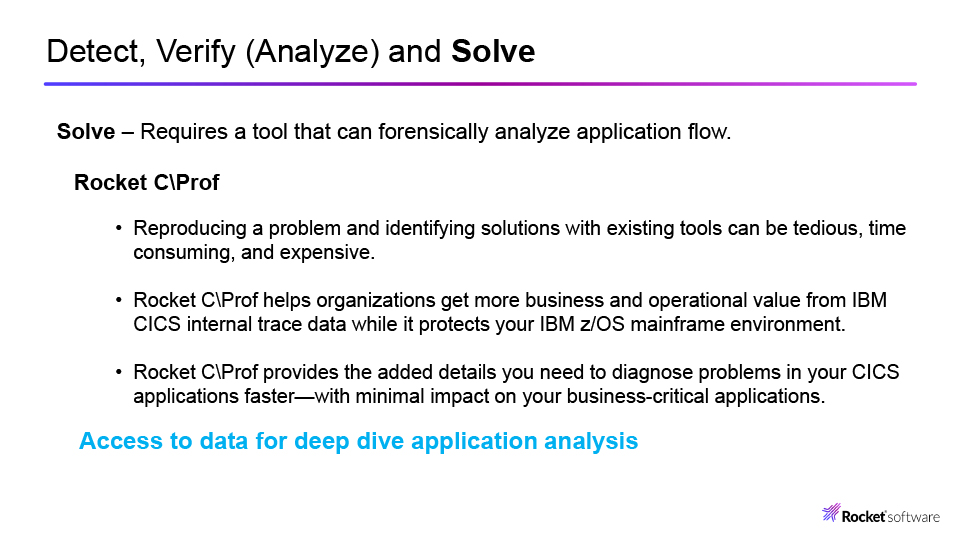
Finally, the “Solve” stage is all about detailed application analysis. Gross introduced Rocket C\Prof, a powerful tool that collects CICS trace data without running within a CICS region. Access to such detailed information helps resolve complex issues faster, streamlining the problem-solving process.
Throughout his presentation, Gross stressed the importance of using additional tools to enhance performance analysis and monitoring. IBM OMEGAMON for CICS was highlighted as a valuable tool for detection, monitoring, and remediation at a high level. Real-time and historical data collection, proactive alerting, and bottleneck analysis were emphasized as key features. The tool also allows users to check the overall system health and drill down to individual regions to identify and resolve performance issues efficiently.
Gross further discussed the significance of CICS Performance Analyzer (CICS PA) for performance analysis and monitoring. Collecting SMF data provides a better understanding of system performance over time. CICS PA offers pre-built report forms and report sets that simplify data analysis.
Various data classes, such as Performance, Exception, Identity, and Transaction Resource Identity, can be collected using CICS PA. Analyzing SMF data has numerous benefits, including improving resource usage, transaction performance, availability, aiding in capacity planning and tuning, and providing application-level performance analysis.
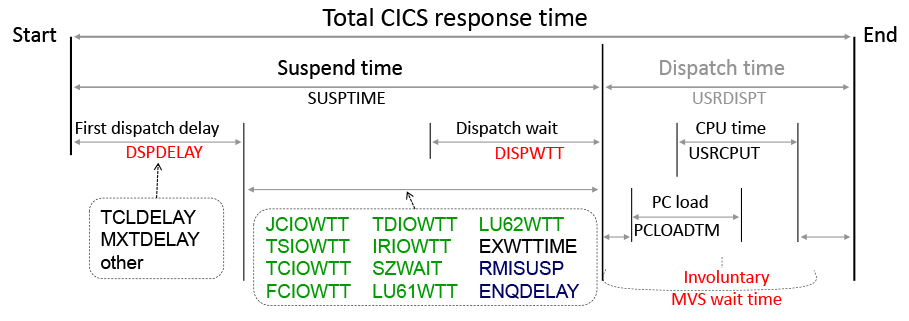
In his presentation, Gross delved into response time structure, suspend time breakdown, and different types of waits that occur in a CICS environment. The CPU to dispatch ratio was highlighted as a key metric to monitor, and statistics recording was recommended for better performance analysis.
Gross demonstrated an example report generated by CICS PA for a customer’s web services transactions. The report helped identify transactions with high CPU usage and focus on areas that needed tuning, resulting in significant performance improvements.
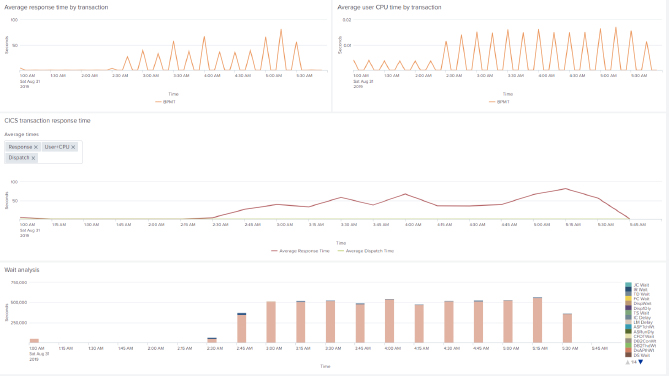
Moreover, Gross introduced CICS Performance Analyzer’s support pack, CA Ten, which enables data visualization in JSON format. This allows for the creation of easy-to-read dashboards and graphs. He showcased sample dashboards generated with Splunk and Elastic Dashboards, emphasizing the benefits of visualizing data, especially when reporting to upper management.
Gross presented Rocket C\Prof as a tool for deep dive analysis within CICS. C\Prof uses cross-memory services to collect trace information without impacting CICS performance. It aggregates data from multiple regions and presents it in a higher-level format, making it easier for application programmers and junior Sysprogs to analyze trace data. The tool allows users to record application traces, format data for AUX Trace, and enables historical analysis of CICS events.
In conclusion, Gross’s presentation highlighted the importance of using advanced tools for CICS performance analysis and problem-solving. With the Detect, Verify, and Solve methodology, professionals can overcome the challenges posed by modern applications and ensure optimal system performance in today’s dynamic business environment. By embracing tools like IBM OMEGAMON for CICS, CICS Performance Analyzer, CA Ten, and Rocket C\Prof, IT teams can make data-driven decisions, improve efficiency, reduce downtime, and create a smoother experience for end-users.
Watch the Recording
If you would like to watch the recording of this presentation with full transcription it is available here!
Registrations are also open for the next Virtual CICS User Group Meeting – September 12, 2023.


0 Comments