


PJ46275 provided the ability for the tpfrtmc offline utility to monitor JVM data from a single z/TPF processor.
PJ46608 provides the ability for the tpfrtmc offline utility to monitor JVM data from up to 10 z/TPF processors. As such, a single tpfrtmc offline utility can simultaneously process data from 10 z/TPF systems sending message analysis tool data, 10 z/TPF systems sending JVM data, 1 z/TPF system sending CDC data, and 1 z/TPF system sending NVPC data.
The z/TPF real-time insights dashboard starter kit has been updated with the following features:
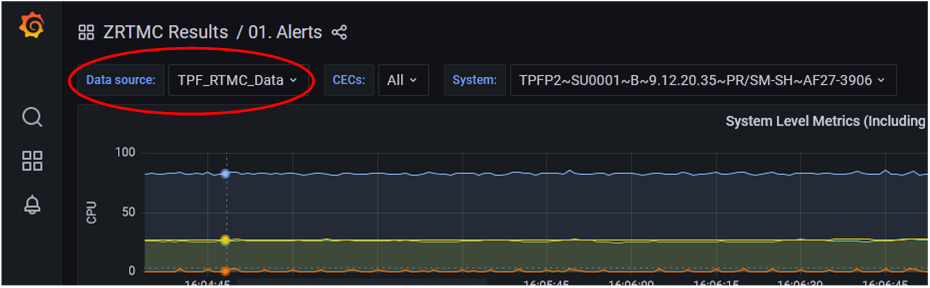
Data Source Selector. All sample dashboards now provide a data source selector which allows you to choose which MariaDB instance or database you want to view. A data source can represent a complex, geography, test complex or etc. In this way, you can configure Grafana to be able to view the data from any data source.
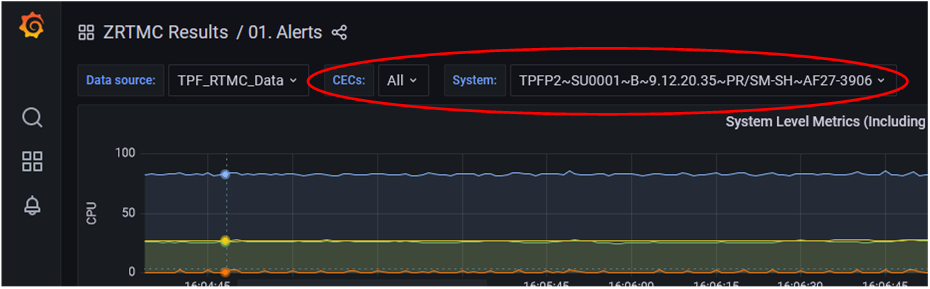
System Selector. All sample dashboards now provide a CEC filter and system selector which allows you to choose which to choose which LPAR or VPARS system you want to view. The systems are named as LPAR name or VM Guest name, complex name, processor id, IP address, machine type, and CEC identifier.
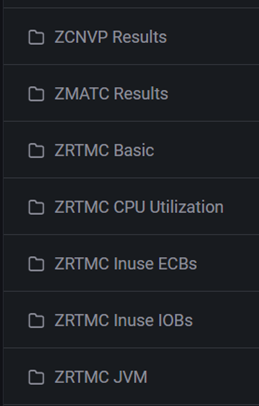
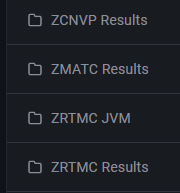
Folder Reorganization. The folder layout of the dashboards has been simplified based upon user feedback.
Previous folder layout:
New folder layout:
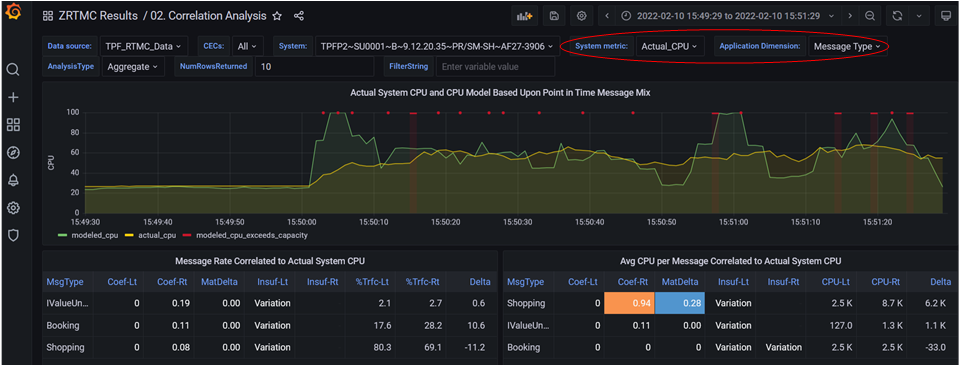
Correlation Analysis Dashboard. The correlation analysis dashboards have been condensed into a single dashboard that allows you to select the system metric and the application dimension to correlate. As part of this change, this dashboard has fewer panels such that it refreshes more quickly.
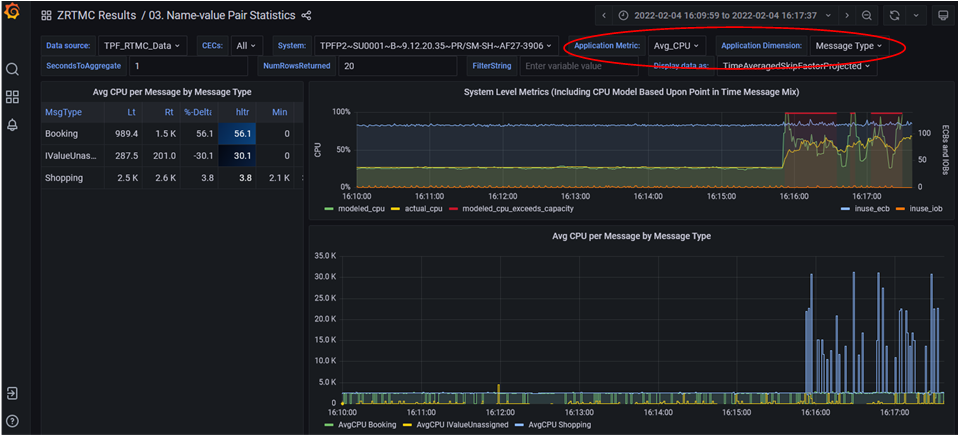
Name-value Pair Statistics Dashboard. The statistics dashboards have been condensed into a single dashboard that allows you to select the system metric and the application dimension. As part of this change, this dashboard has fewer panels such that it refreshes more quickly.
For more information about APAR PJ46608, see the APEDIT. For more information about the z/TPF real-time insights dashboard starter kit, see the z/TPF Tools download page.
Originally published on the IBM Z and LinuxONE Community Blog.


0 Comments